Every trader eventually asks the same question. Has this move gone too far? After two decades of watching charts across stocks, forex, and crypto, I can say that momentum tools answer that question better than price alone. The relative strength index remains the most practical of them all. Moreover, it is simple enough to read in seconds, yet deep enough to reward years of study.
In this guide, you will learn what the RSI indicator is, how it is calculated, and how to read overbought and oversold conditions correctly. You will also learn where most beginners go wrong. Let us start with the basics.
What Is the RSI Indicator?
So, what is the RSI indicator in plain terms? The relative strength index is a momentum oscillator. It measures the speed and size of recent price changes. Then it plots the result on a scale from 0 to 100.
The tool was developed by J. Welles Wilder Jr. and introduced in 1978. It appeared in his book New Concepts in Technical Trading Systems. Decades later, it still ships as a default indicator on nearly every charting platform.
Here is the key idea. Price tells you where the market is. The relative strength index tells you how forcefully it arrived there. Because of this difference, the tool often reveals fatigue before the chart does.
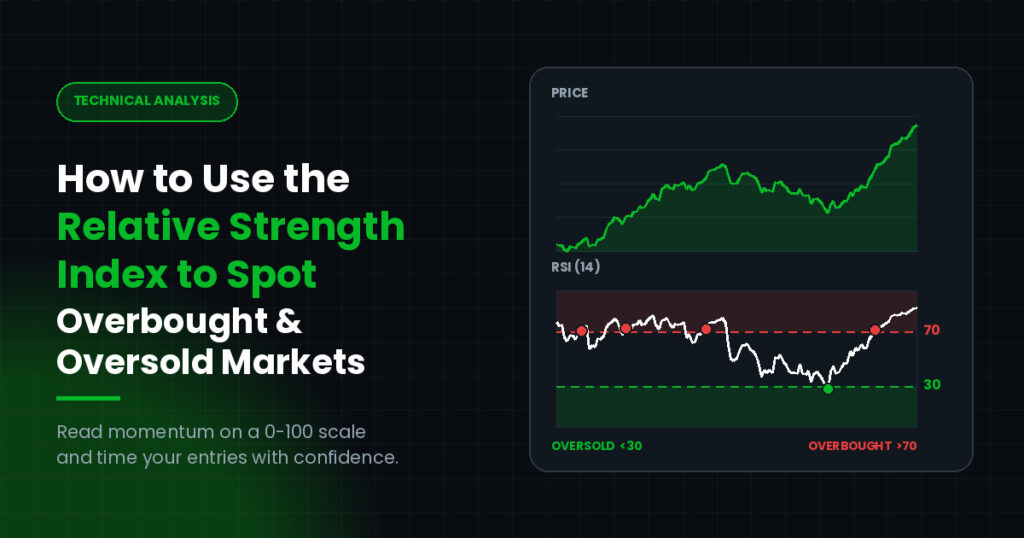
Traders usually plot the RSI indicator in a separate panel below the price. Two horizontal lines are drawn at 70 and 30. Those lines mark the classic overbought and oversold zones.
How the RSI Indicator Works
Now let us look at how the RSI indicator works under the hood. You do not need advanced maths. Still, a basic grasp helps you trust the readings.
The Calculation in Plain English
First, the indicator looks back over a set number of candles. The default is 14. Next, it separates those candles into gains and losses. Then it averages each group.
Finally, it compares average gains with average losses. That ratio is converted into a number between 0 and 100. When gains dominate, the line rises. When losses dominate, the line falls.
In other words, the reading is relative. A stock does not become overbought because it reached a certain price. It becomes overbought because buying pressure has recently outpaced selling pressure by a wide margin.
Why 14 Periods Became the Standard
Wilder chose 14 periods, and the setting stuck. Shorter settings react faster. For example, an RSI(7) fires far more signals. However, many of those signals are noise.
Longer settings smooth the line. An RSI(21) produces fewer extremes, yet those extremes carry more weight. Therefore, swing traders often stretch the lookback, while scalpers shorten it.
My advice after years of testing is simple. Start with 14. Change it only when you have a clear reason and a record to support the change.
Reading Overbought and Oversold Levels
This is where most people focus, and rightly so. The zones are easy to spot.
When the Line Climbs Above 70
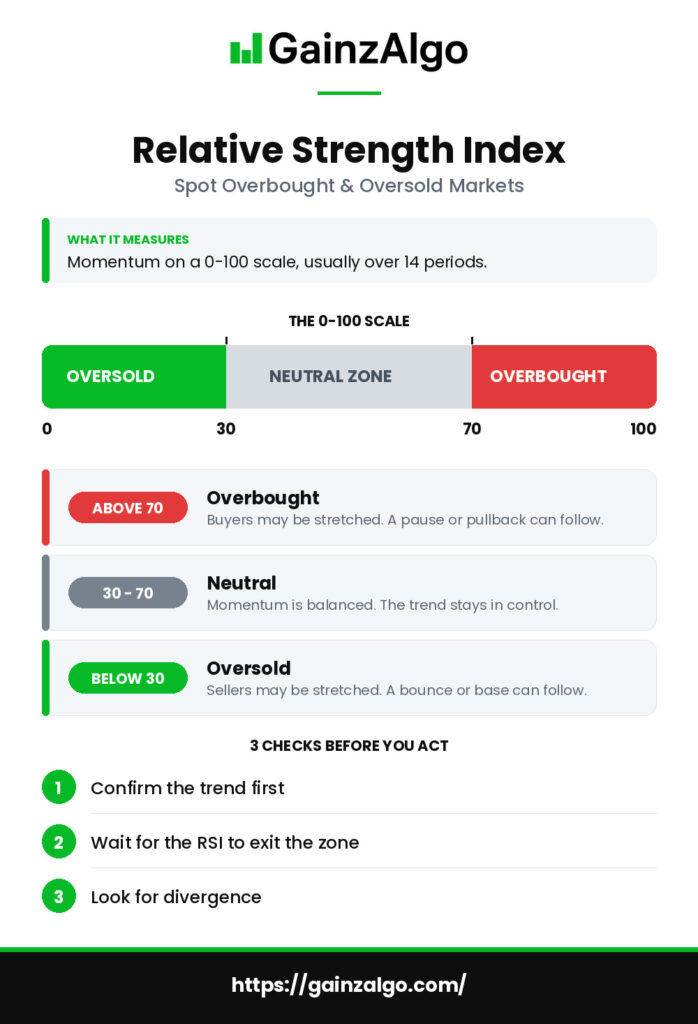
A reading above 70 is called overbought. It signals that buyers have pushed hard and fast. Momentum has become stretched.
However, overbought does not mean the top is in. During strong uptrends, the relative strength index can stay above 70 for weeks. Traders who short every touch of that line usually pay for the lesson.
Instead, treat 70 as a caution flag. Position sizing deserves a second look. Trailing stops deserve tightening. Fresh long entries deserve patience.
When the Line Drops Below 30
A reading below 30 is called oversold. Sellers have dominated recent candles. Selling pressure may soon be exhausted.
Again, exhaustion is not a reversal. In a bear market, the line can hug the 20s for a long stretch. Prices keep sliding while dip buyers get trapped.
Consequently, oversold readings work best as alerts. They tell you where to start watching for a base, not where to buy blindly.
Why “Overbought” Never Means “Sell Now”
This single misunderstanding costs traders more money than any other. Let me explain why.
The relative strength index measures momentum, not value. Strong trends are built on strong momentum. As a result, the healthiest rallies produce the most overbought readings.
Think of it like a car’s speedometer. A high reading tells you the vehicle is moving quickly. It does not tell you that a wall lies ahead.
Because of this, experienced traders combine the tool with context. Trend direction matters. Support and resistance matter. Volume matters too. The signal is one input among several.
Practical Methods for Using RSI in Trading
Theory is easy. Execution is harder. These four methods have served me well when using RSI in trading across different markets.
Method 1: Wait for the Exit, Not the Entry
Do not act when the line enters a zone. Act when it leaves.
For example, suppose the RSI indicator drops to 24. Then it curls back above 30. That crossing shows selling pressure is fading. Your risk is defined by the recent swing low.
This one adjustment filters out a large share of false signals. Furthermore, it keeps you out of trades that are still falling.
Method 2: Trade in the Direction of the Trend
Trends deserve respect. Therefore, use the zones selectively.
In an uptrend, hunt for oversold readings and ignore overbought ones. Those dips often mark pullbacks inside a larger advance. In a downtrend, do the opposite. Overbought readings mark rallies that are likely to fail.
A simple moving average helps here. Price above a 200-period average suggests an uptrend. Price below it suggests a downtrend.
Method 3: Watch for Divergence
Divergence is the most valuable signal the tool produces. It appears when price and momentum disagree.
Bearish divergence forms when price prints a higher high, yet the relative strength index prints a lower high. Buyers are pushing, but with less force. Bullish divergence forms when price prints a lower low while momentum prints a higher low.
Divergences are strongest at major levels and on higher timeframes. Meanwhile, divergences on a one-minute chart tend to be noise. Be selective.
Method 4: Adjust the Zones to the Market
The 70/30 defaults are a starting point, not a law.
In a persistent bull market, shift the levels to 80 and 40. In a bear market, try 60 and 20. Range-bound markets, on the other hand, respect the classic settings well.
This small tweak makes signals far more reliable. It also reflects how markets actually behave.
Choosing the Right Timeframe
Timeframe changes everything. A daily chart reading and a five-minute reading can point in opposite directions. Neither is wrong.
Higher timeframes produce fewer signals with better quality. Lower timeframes produce plenty of signals with more noise. Consequently, many traders use two charts at once.
Here is a method I still rely on. Check the daily chart for direction. Then use the four-hour or one-hour chart for timing. Momentum must align on both before a trade is taken.
Common Mistakes I Still See
Some errors repeat themselves year after year. Avoid these four.
Firstly, traders fade every extreme reading. Strong trends punish that habit quickly. Secondly, traders ignore the surrounding structure. A signal at mid-range means far less than one at major support.
Thirdly, settings get changed after every losing trade. That habit destroys consistency. Finally, traders rely on the oscillator alone. No single indicator survives every market condition.
A Simple Checklist Before You Act
Discipline beats prediction. Therefore, run through these questions before any entry.
What is the trend on the higher timeframe? Has the line actually exited the zone, or is it still inside? Does price sit at a meaningful level? Is divergence present or absent? Where exactly is your invalidation point?
If two or more answers are unclear, skip the trade. Patience is a position too. Above all, protect your capital first and chase returns second.
Final Thoughts
The relative strength index has survived nearly fifty years for good reason. It is simple, visual, and honest about momentum. Yet it rewards context far more than blind rule-following.
Start with the default 14-period setting. Trade with the trend. Wait for the zone exit. Respect divergence at key levels. Then let your results guide small refinements over time. At GainzAlgo, we believe that clear, well-tested tools and steady habits matter more than complicated systems, and momentum reading is one of the most useful habits a trader can build.